
Contributed by Bismark Ofosu-Bamfo.
At the start of my PhD on liana ecology in 2018, I was scarcely familiar with the term phenology. I had never given it a consideration as something I would like to pursue until my PhD advisor suggested it. I was interested in a one-off vegetation survey, possibly in several places rather than stay at something for very long. I had no prior experience collecting phenological data; however, I was soon to realize there is a lot of variability surrounding phenological observations. While some scientists focus on only presence/absence data, others go to the extent of quantifying how many flowers are on a plant, how many of those flowers are buds, etc.?
I had to be sure that the data I collected would be useful and could be used in metadata analysis in the future. I had several questions: which lianas would I tag in a forest, how many would I tag, how will I quantify observations, how will my datasheet look like and several others? I wanted to reach out to someone who had been practically involved in phenological monitoring and ask for help. Thankfully, the African Phenology Network offered a lot of help.
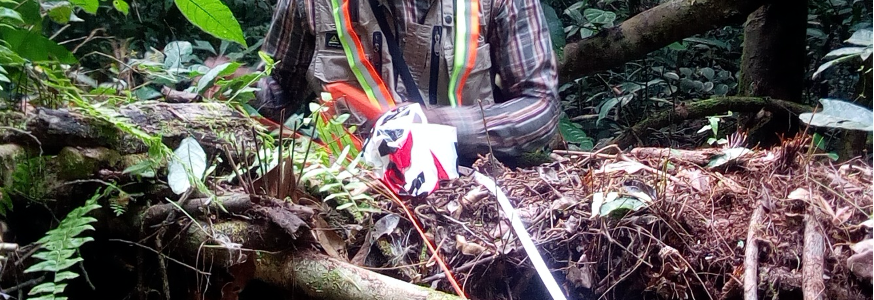
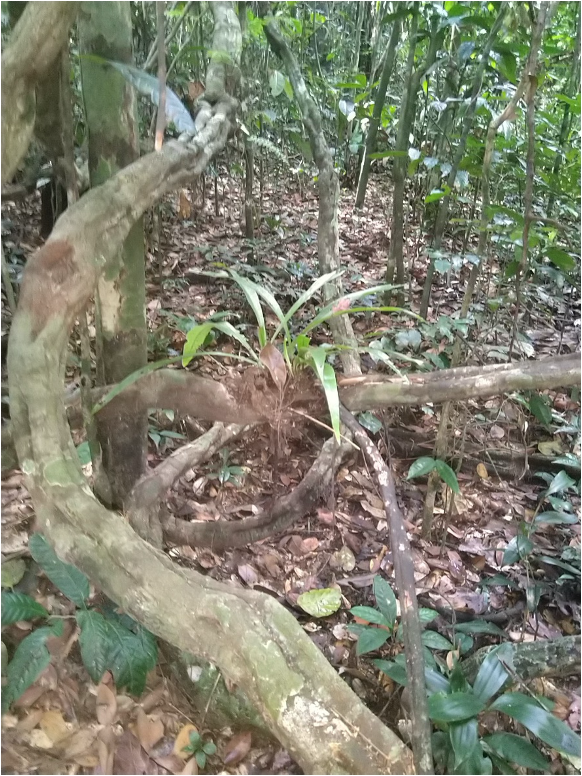
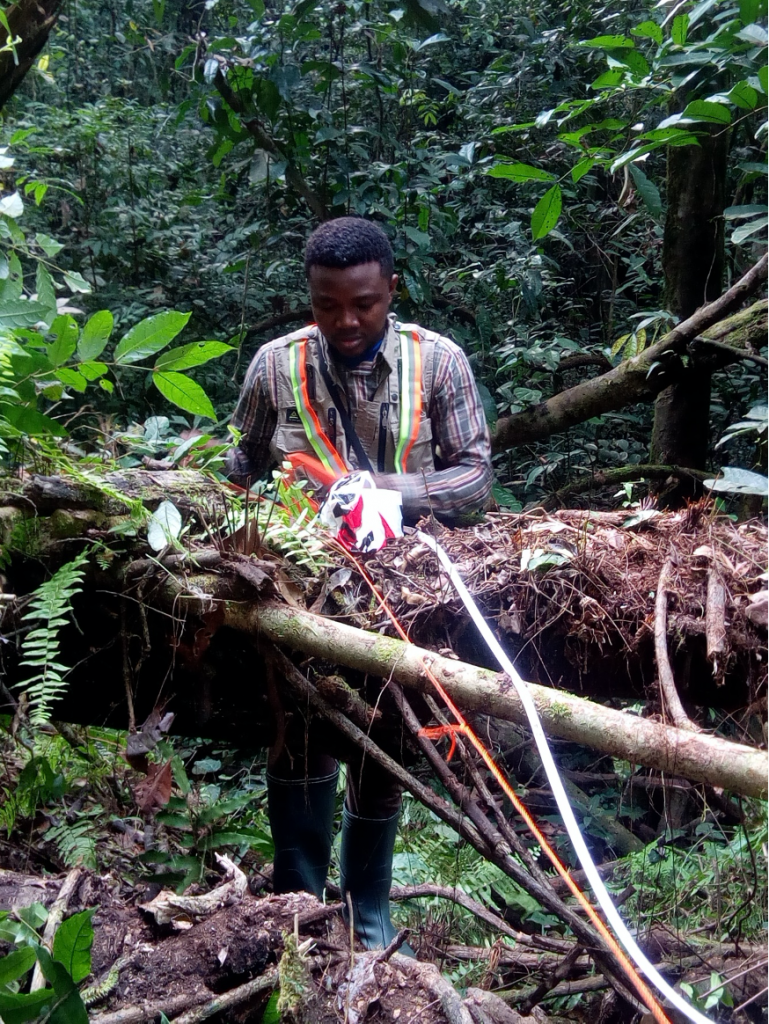
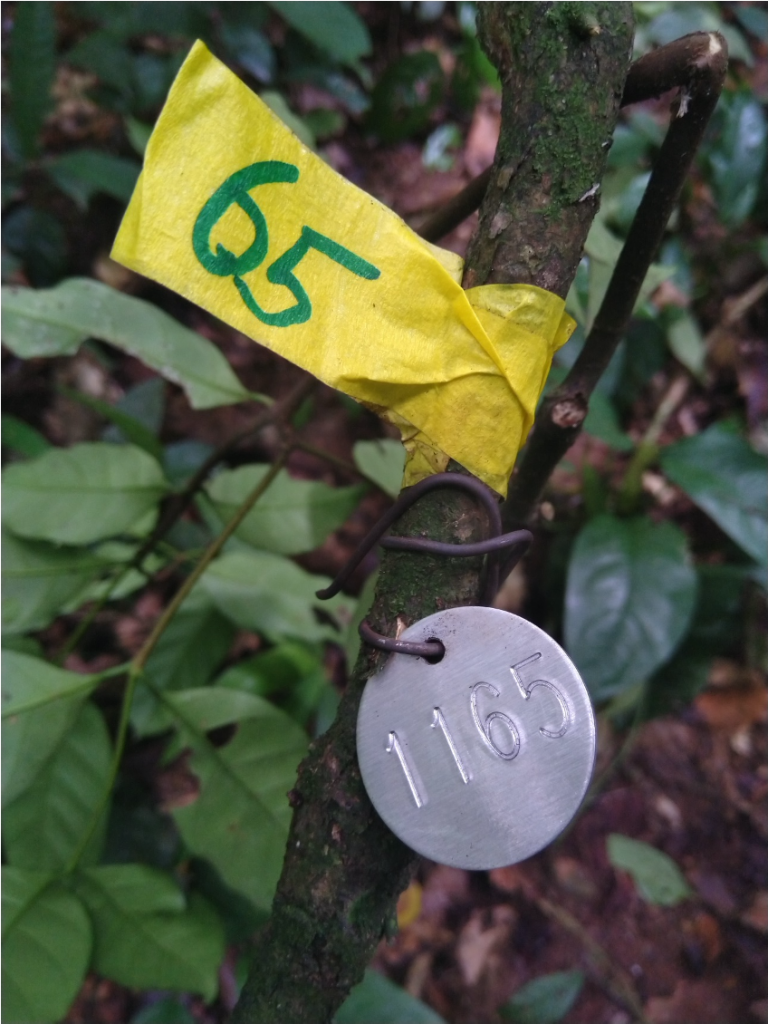
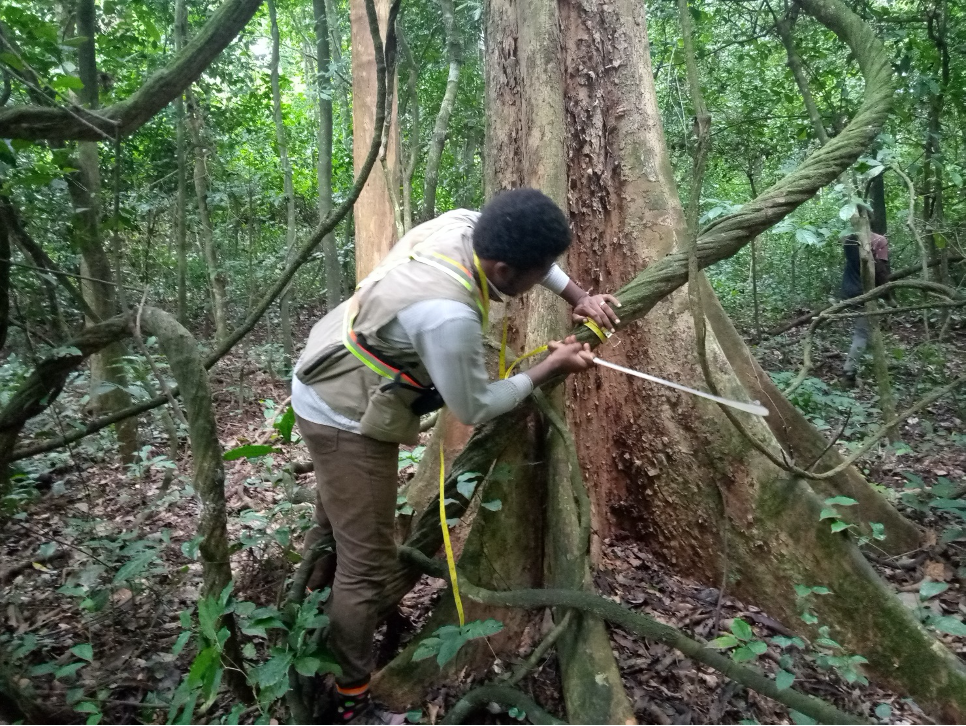
Since phenology could potentially serve as a proxy for changing climate, I decided to make up for time with space by observing liana phenology in three ecosystem types that had somewhat varied climatic conditions. I chose a wet evergreen forest (receives > 2000 mm MAP, humid climate), a moist semi-deciduous forest (receives 1500 – 1700 mm MAP) and a dry semi-deciduous forest (receives < 1500 mm MAP, dry climate). In each of these forests I set up two 1 ha permanent plots. Each plot was divided into 20*100 m belt transects. This was done so that we could closely observe all rooted liana stems in our plots for the presence of flowering, fruiting or leafing phenology and then tag those.
A number of options were available to consider for recording phenological observations. I realized these were not tailored to meet my peculiar needs. The BBCH scale, for example, seems to work well when one was working with one to few individuals rather than a lot of individuals at the ecosystem level with limited hands for the work. I settled on developing a data sheet that was tailored to suit my needs.
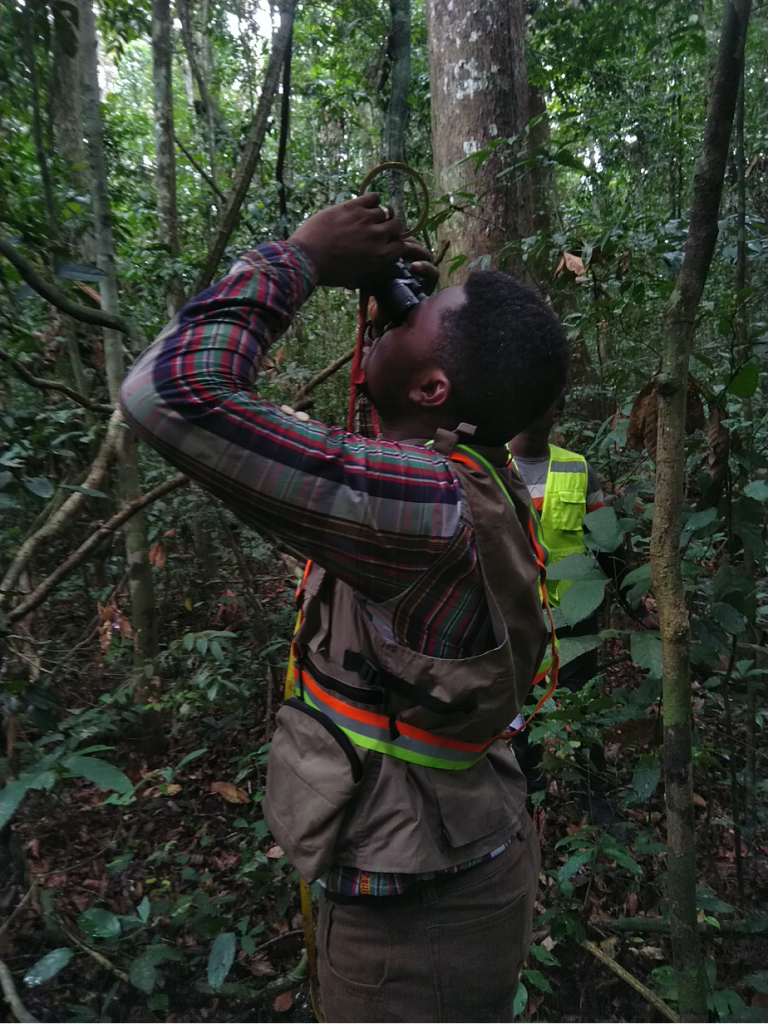
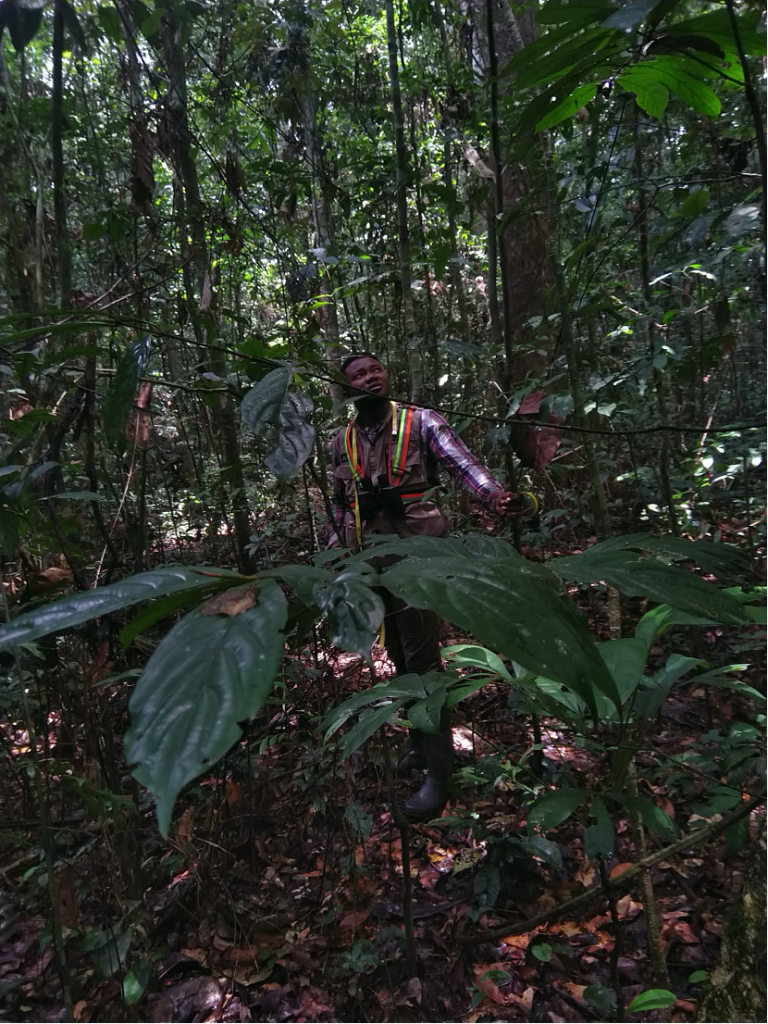
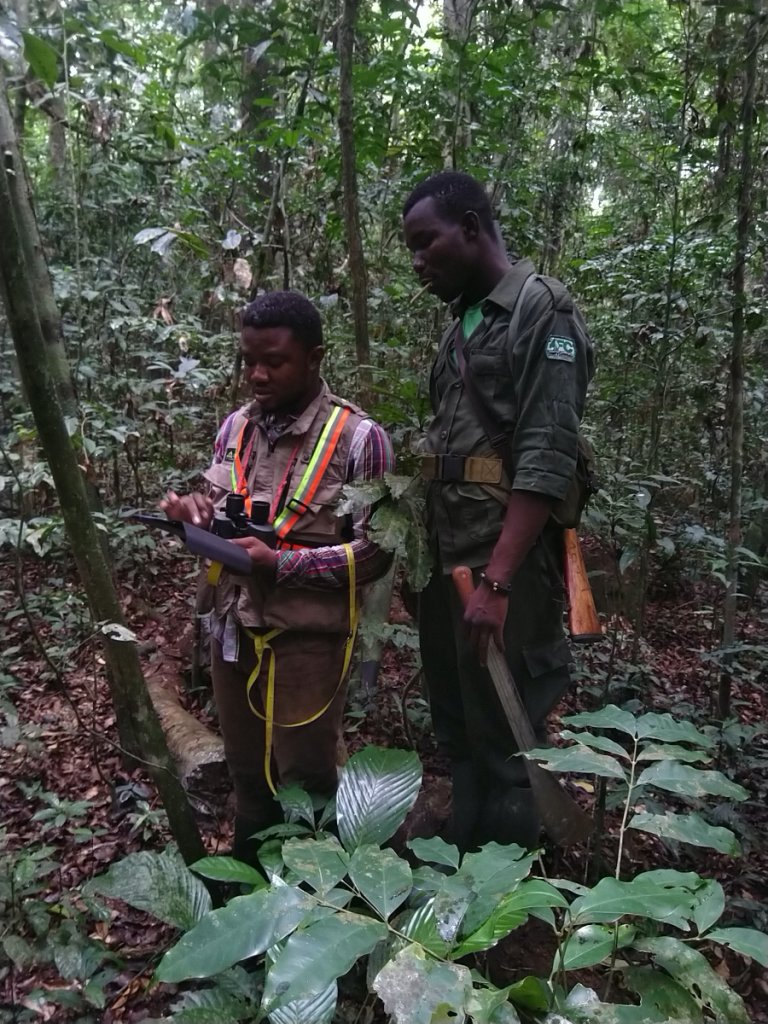
I also noticed that a conventional pen and paper datasheet would increase the cost of running my plots (printing and posting to remote locations each month). Results would also be delayed until field sheets reach my desk with attendant risks of getting lost and errors at data entry. To prevent these, I digitized the data collection form and deployed it on the KoboCollect app on an android tablet. I then trained field assistants in each site who would use the android based app to monitor liana phenology three times in each week.
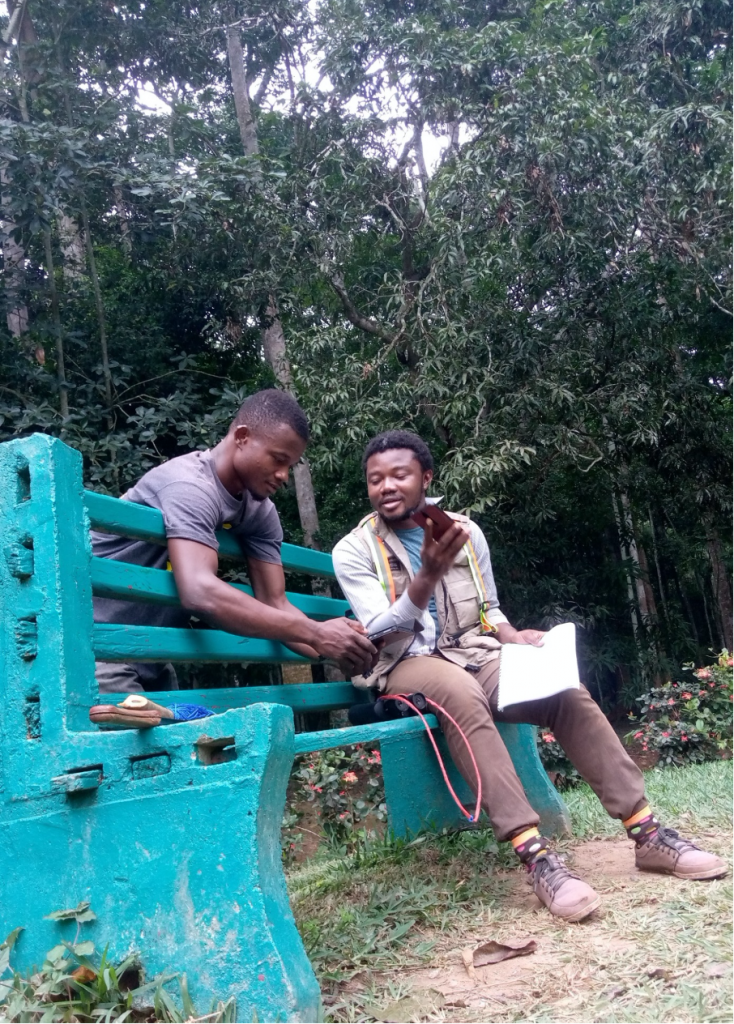
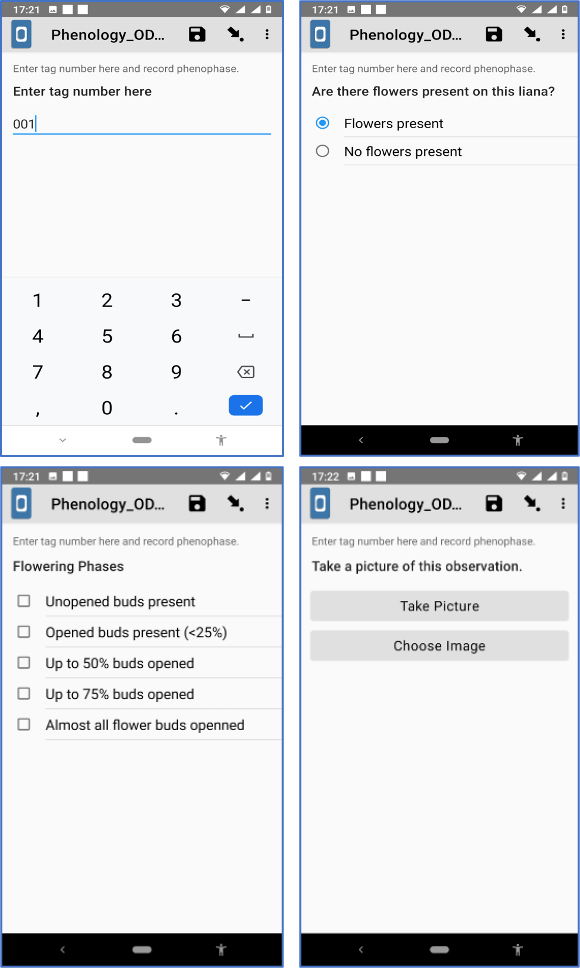
The KoboCollect form allowed for incorporation of skip logic function and prompts to take pictures. For example, one would have to go through the entire field sheet and tick each option as present or absent. However, once the observer indicates flowers absent on the KoboCollect form, the skip logic jumps to the next phenophase of interest and skips questions on sub-phases of flowering such as unopened buds present, opened buds present, all buds opened, etc. When the observer indicates flowering present, the form contains the logic which prompts the observer to take a picture (see sample screenshots below).
Deploying the field sheet on KoboCollect application saved me cost, time and trees! Only one level error is possible, i.e. at the point of making and recording observations. Once at my desk, I simply download field data in excel format and I can already begin to determine what trends have been observed so far. KoboCollect in my case was both economically and ecologically sound!
My work on liana ecology and phenology has received contribution in ideas and suggestions from my PhD Supervisors (Prof. Patrick Addo-Fordjour and Dr. Ebenezer J. D. Belford) and from my mentor at Association for Tropical Biology and Conservation (ATBC), Prof. Jennifer Powers. My field team (Daniel Yawson and Kwame Asare Bediako) have been of great help. I share updates of my work on Twitter, my website and my blog. Kindly follow, visit and subscribe.
Bismark Ofosu-Bamfo is a PhD candidate at the Department of Theoretical and Applied Biology, Kwame Nkrumah University of Science and Technology (KNUST), Kumasi, Ghana. He is also a Lecturer in Ecology at the Department of Basic and Applied Biology (UENR), University of Energy and Natural Resources, Sunyani, Ghana.

